
Case study · Property
One live website that shows every building's leasing progress.
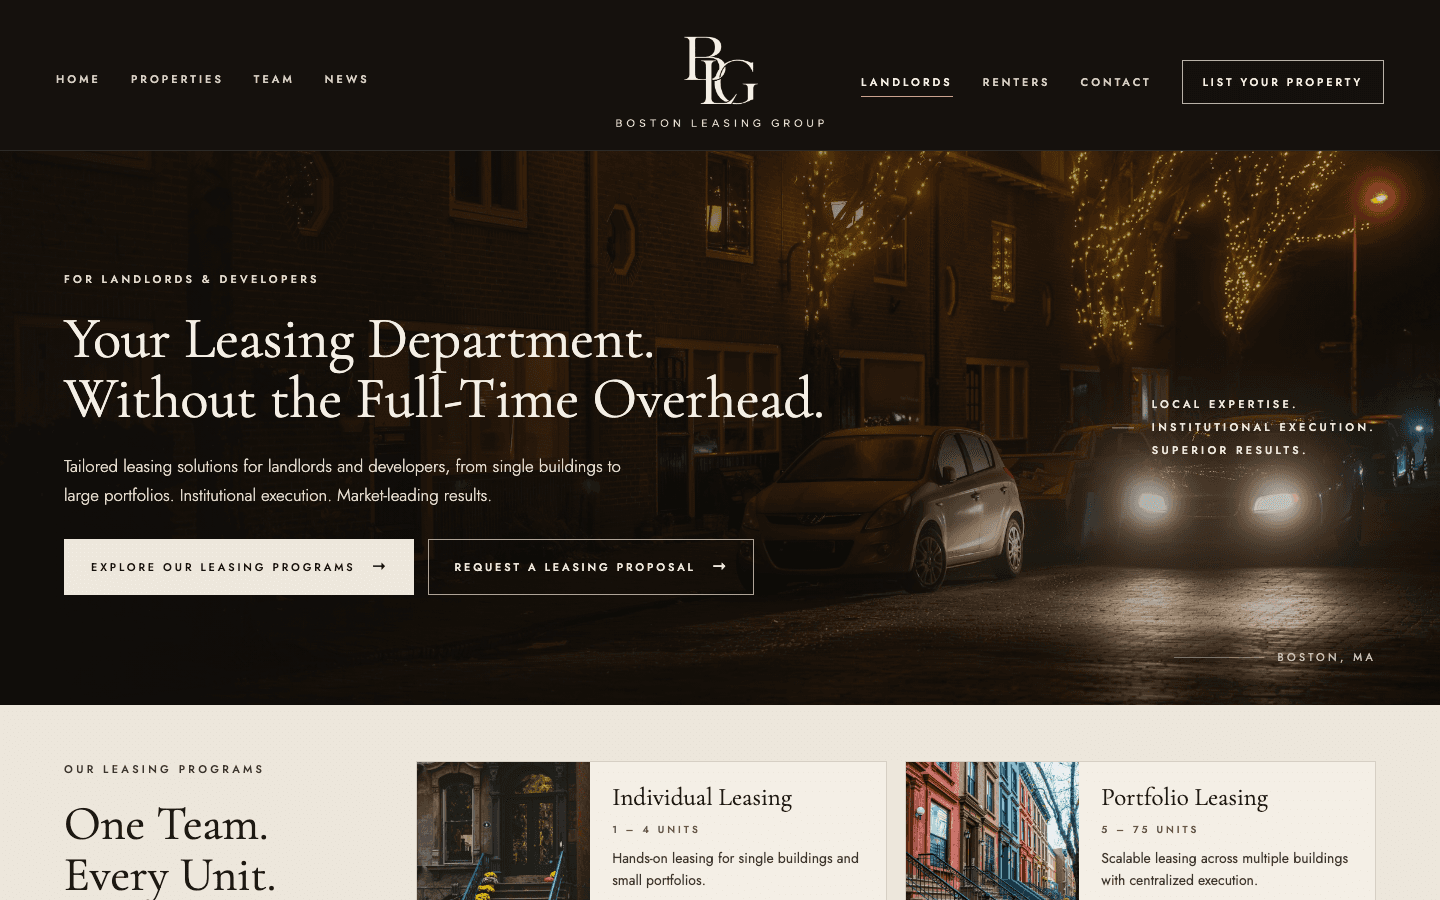
We built Boston Leasing Group a public website and a private admin portal. Owners see live proof of results, renters see what is available, and the team updates it all in seconds.
Instant
One unit update refreshes the ticker, stats, building page and history
0
Occupancy figures typed in by hand
~14 days
From brief to finished site, including two rounds of revisions

Client
Boston Leasing Group is a Boston residential leasing team. It leases whole apartment buildings exclusively for landlords. It is a small, founder-led team.
Problem
Landlords choose a leasing team on proof. Boston Leasing Group had a strong brand idea but no way to show real results.
- Results stuck in spreadsheets. Occupancy lived in spreadsheets and in people's heads.
- Manual reporting. Every unit change had to be reported by hand.
- Nothing for owners to see. Prospective owners could not see how full each building was.
- Nothing for renters to see. Renters could not see which homes were open.
What we built
We understood the problem, then picked the platform that fits. Boston Leasing Group now has a custom website with a private admin portal behind it.
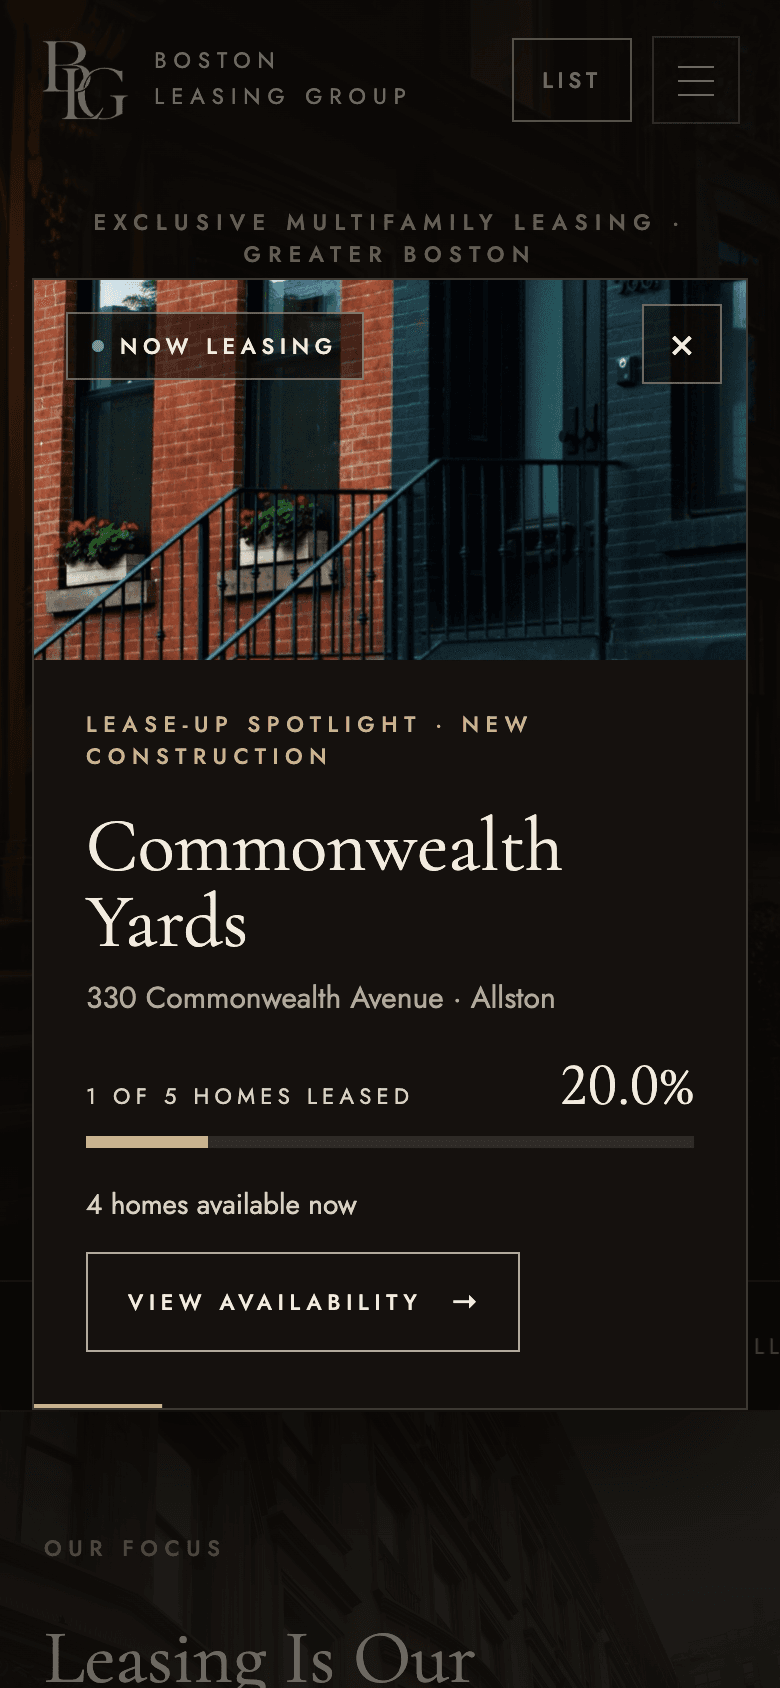
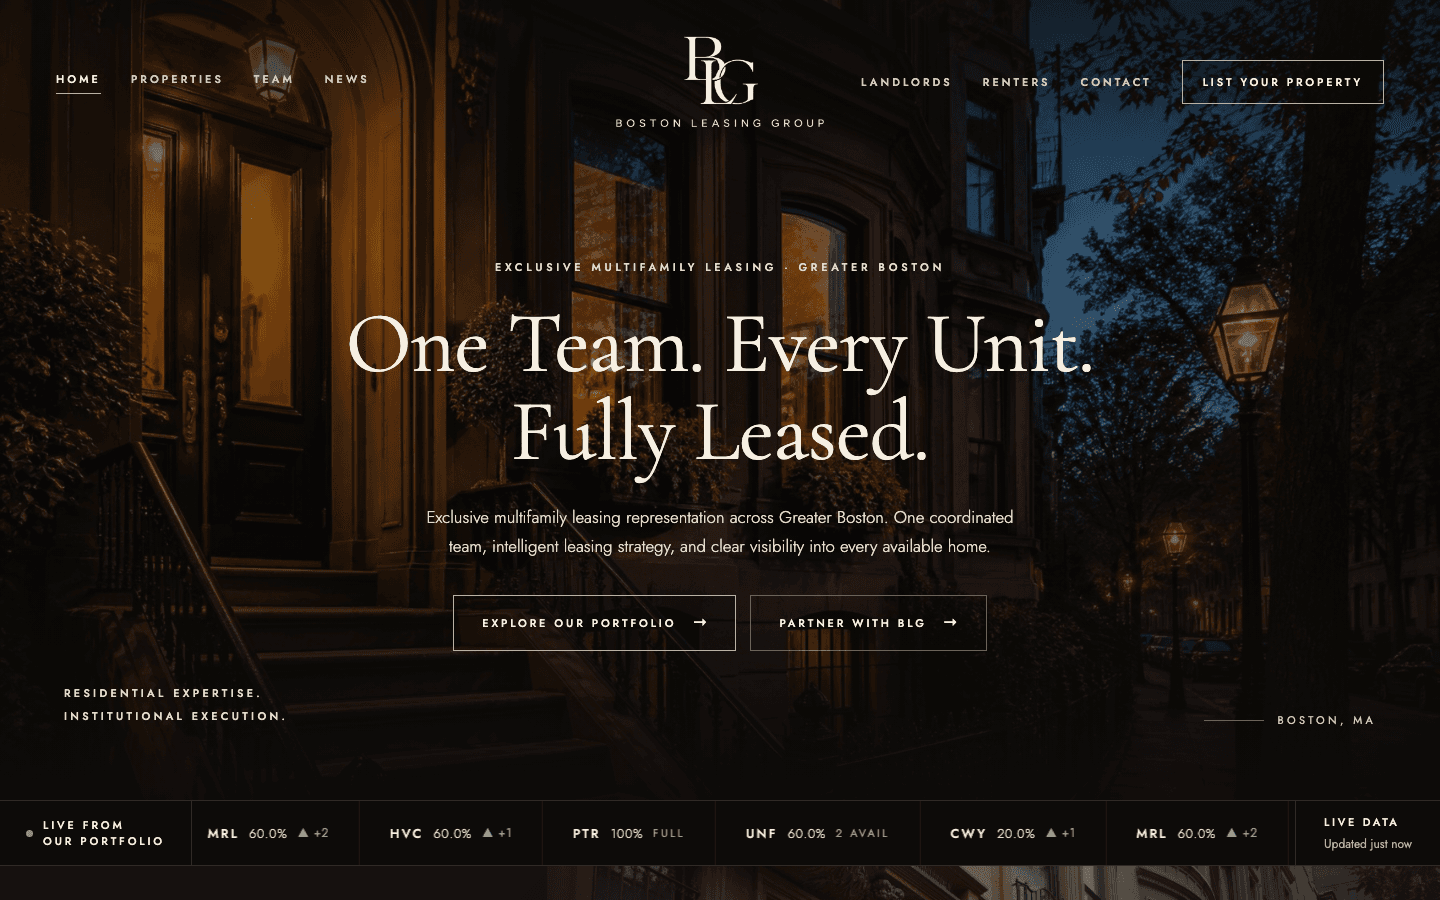
- Live occupancy ticker. Every building's percent leased, updated the moment a unit changes.
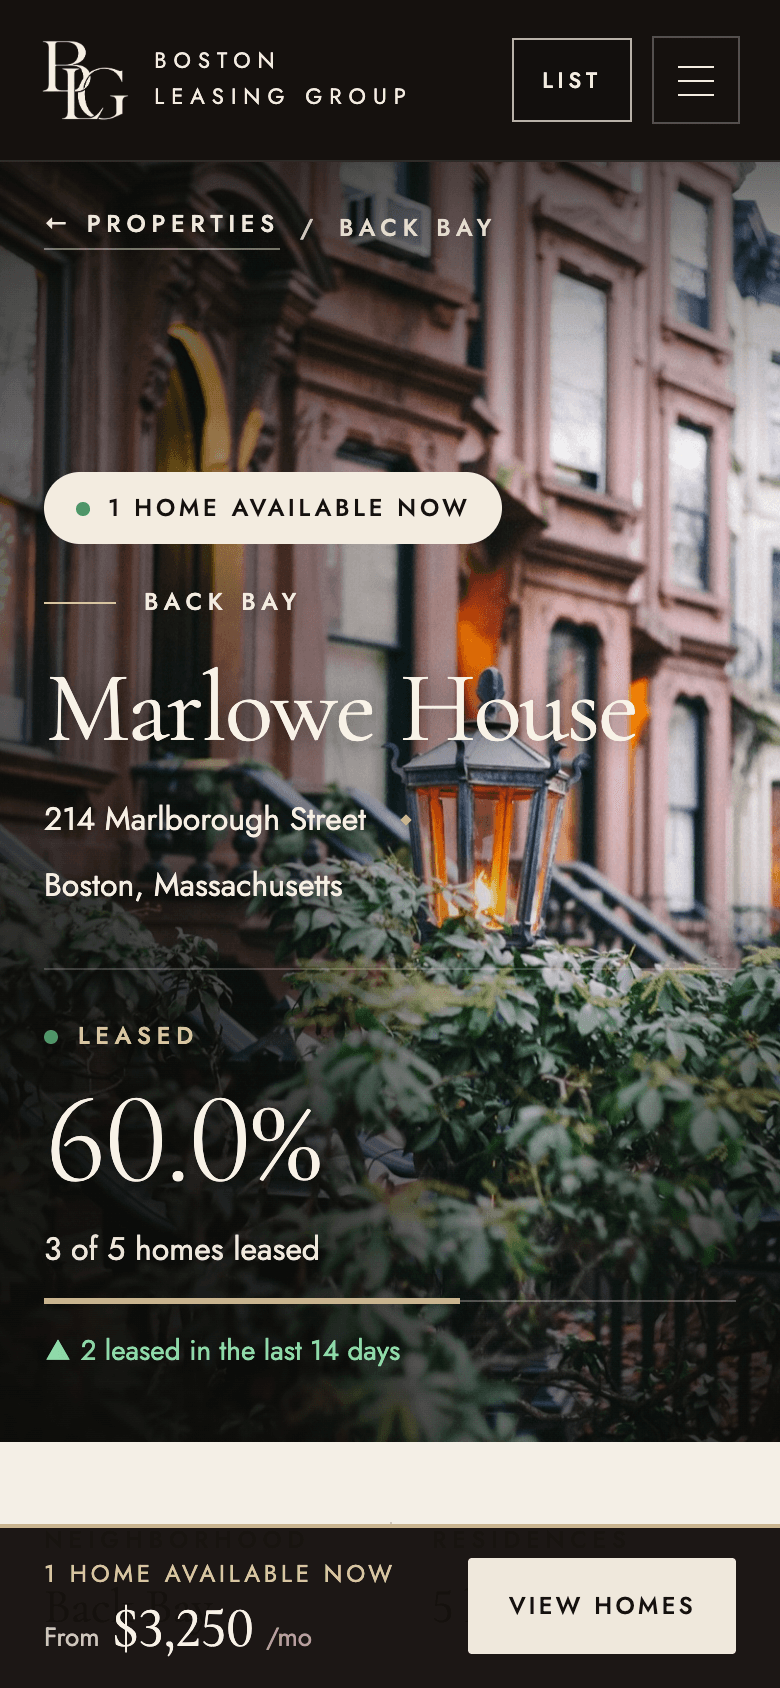
- Property pages. A photo gallery, unit list, rent and an enquiry button for each home.
- Admin portal. The team adds buildings and units, and marks each unit available, leased, coming soon or pending.
- Full history. Every status change is logged with the date, time, person and the agent who closed it.
- Landlord page. A fee calculator and a proposal form.
- Renter search. Filter by bedrooms, neighbourhood, rent and move-in date.
- Limited agent logins. Leasing agents can only switch a unit between available and leased, and never see rents.
Before
Results were tracked by hand and could not be shown to anyone.
After
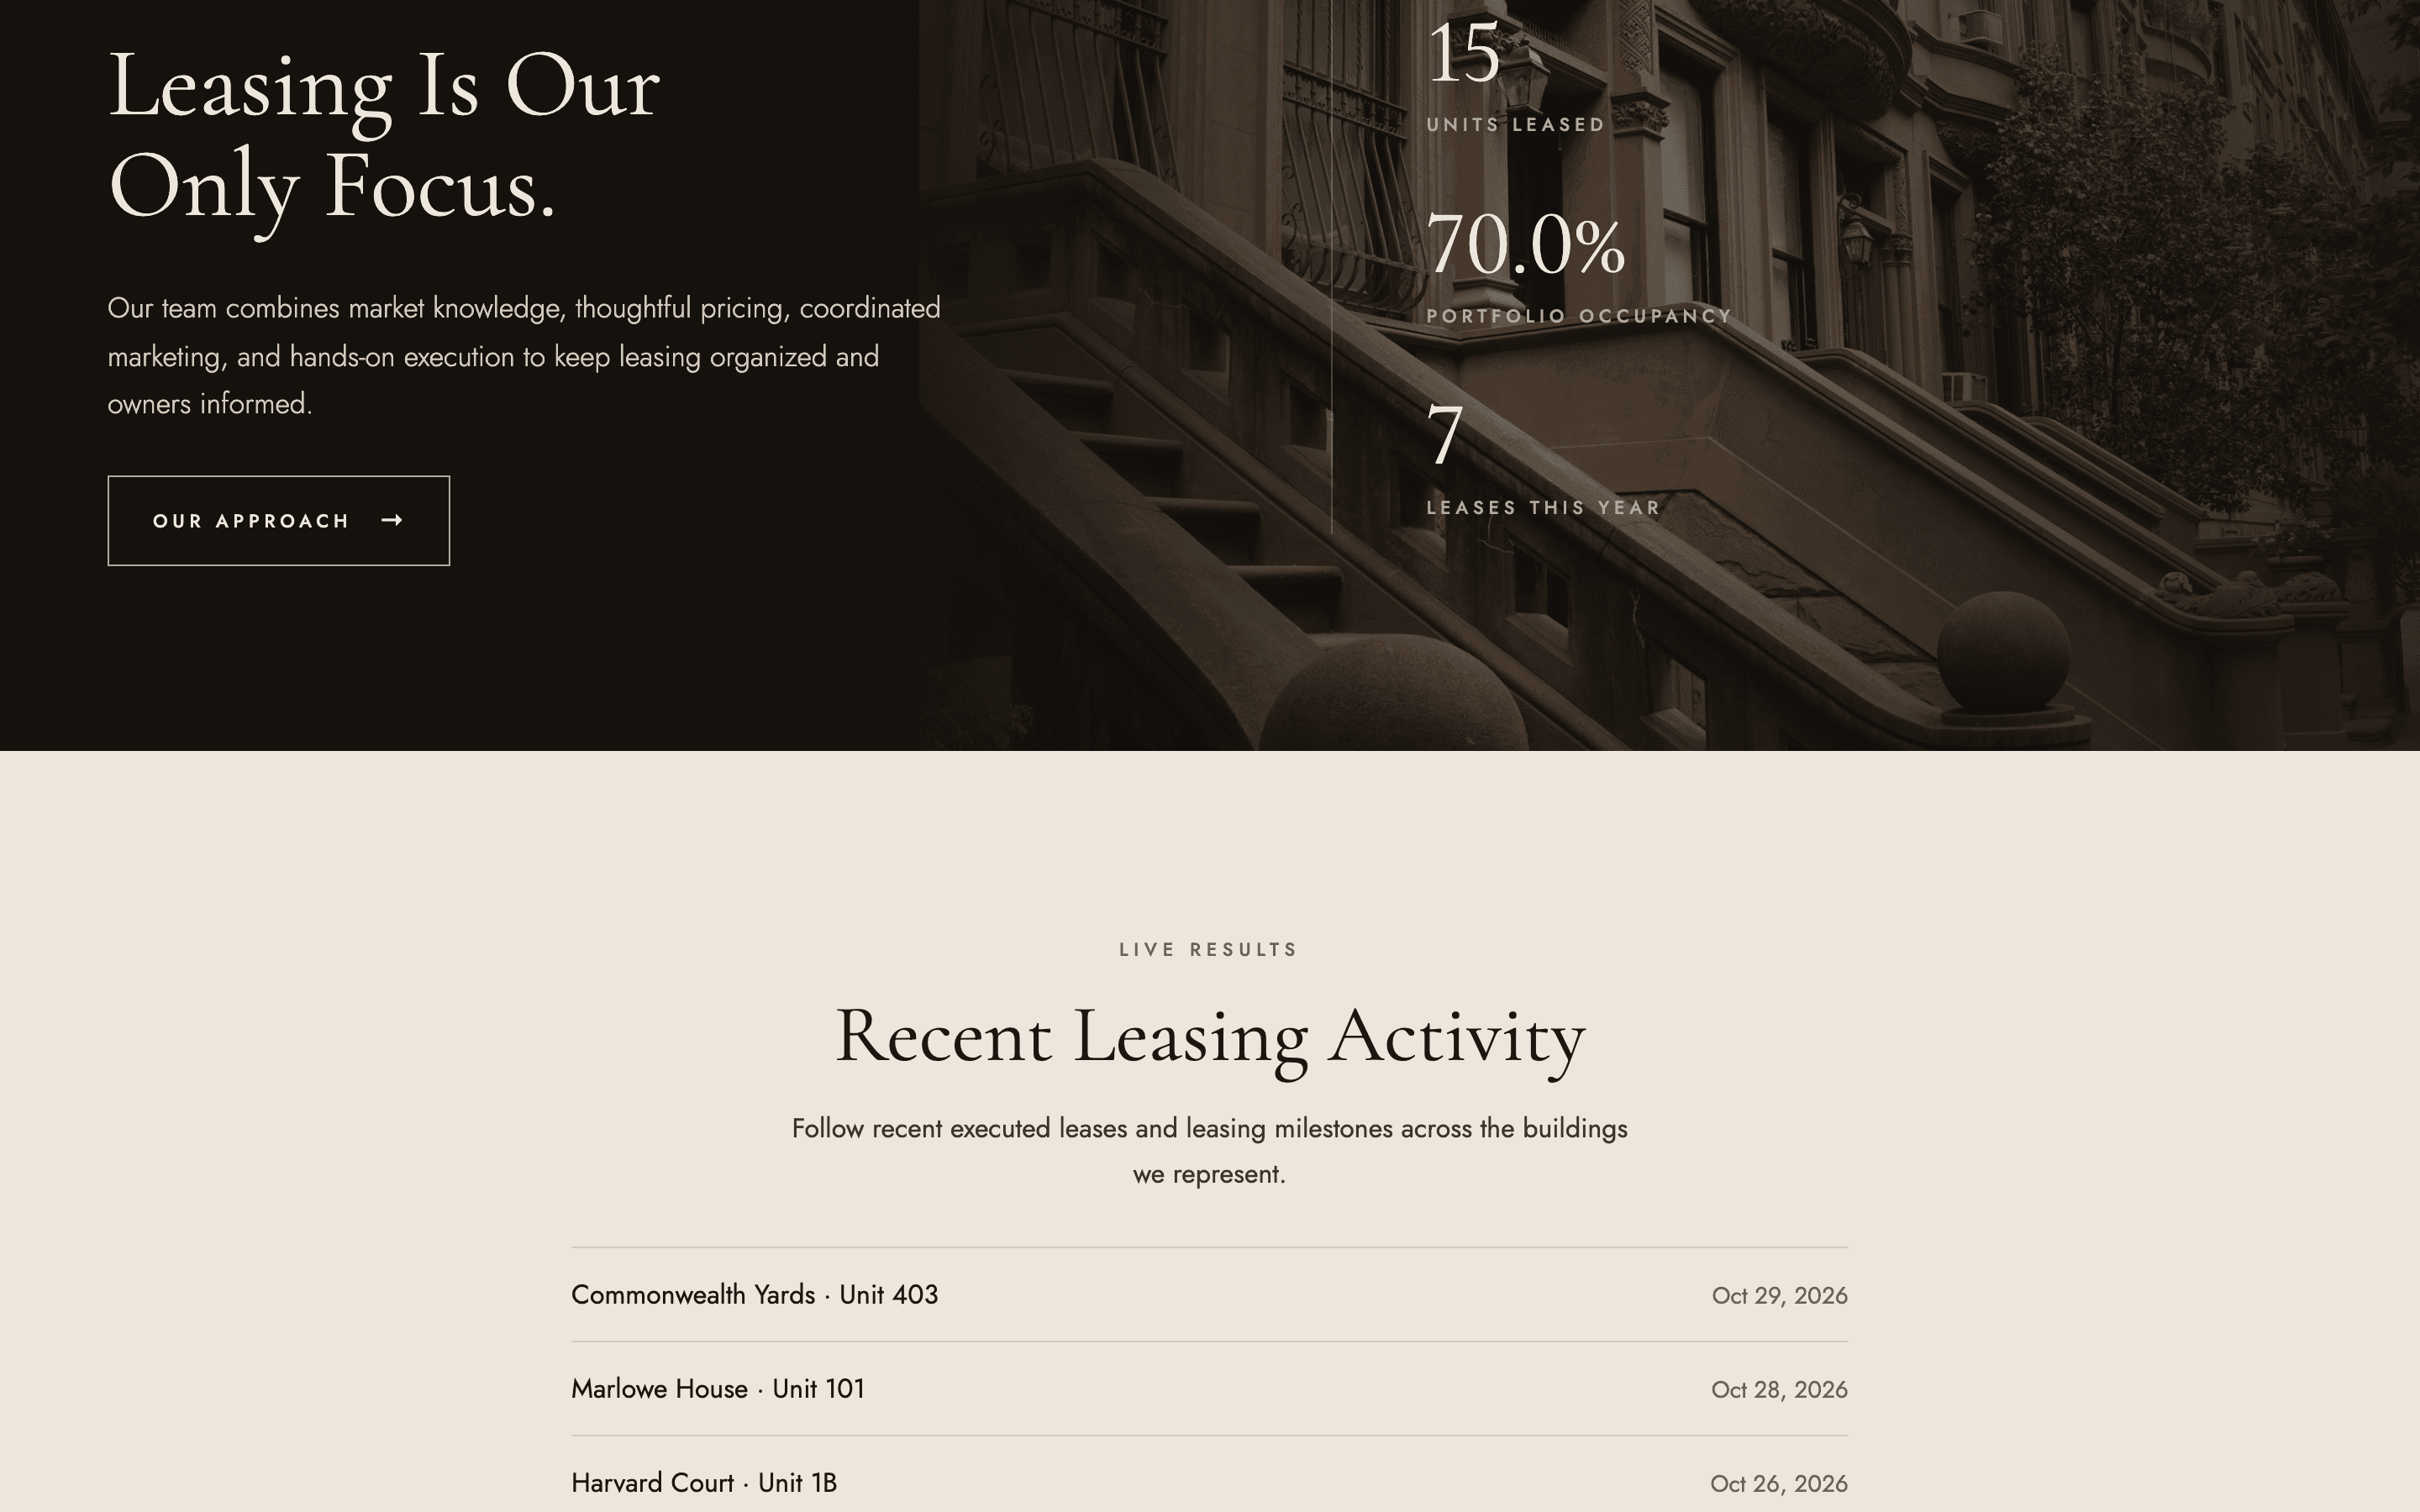
One update in the portal changes the ticker, stats, building page and history instantly.


Results
- Proof that updates itself. Occupancy, units leased and leases this year are calculated automatically. Nobody types them in.
- Enquiries go to the right place. Owner, renter and general enquiries land in separate queues and are emailed to the right inbox.
- Less reporting work. Estimated at 5 to 10 hours a month saved on manual reporting.
Timeline & scope
About 14 days. Delivered: public website, admin portal, agent logins, photo uploads, enquiry emails, a landlord fee calculator and two rounds of client revisions.
Screenshots use sample buildings.
Related
More work like this.
Construction & field services · Internal Tools
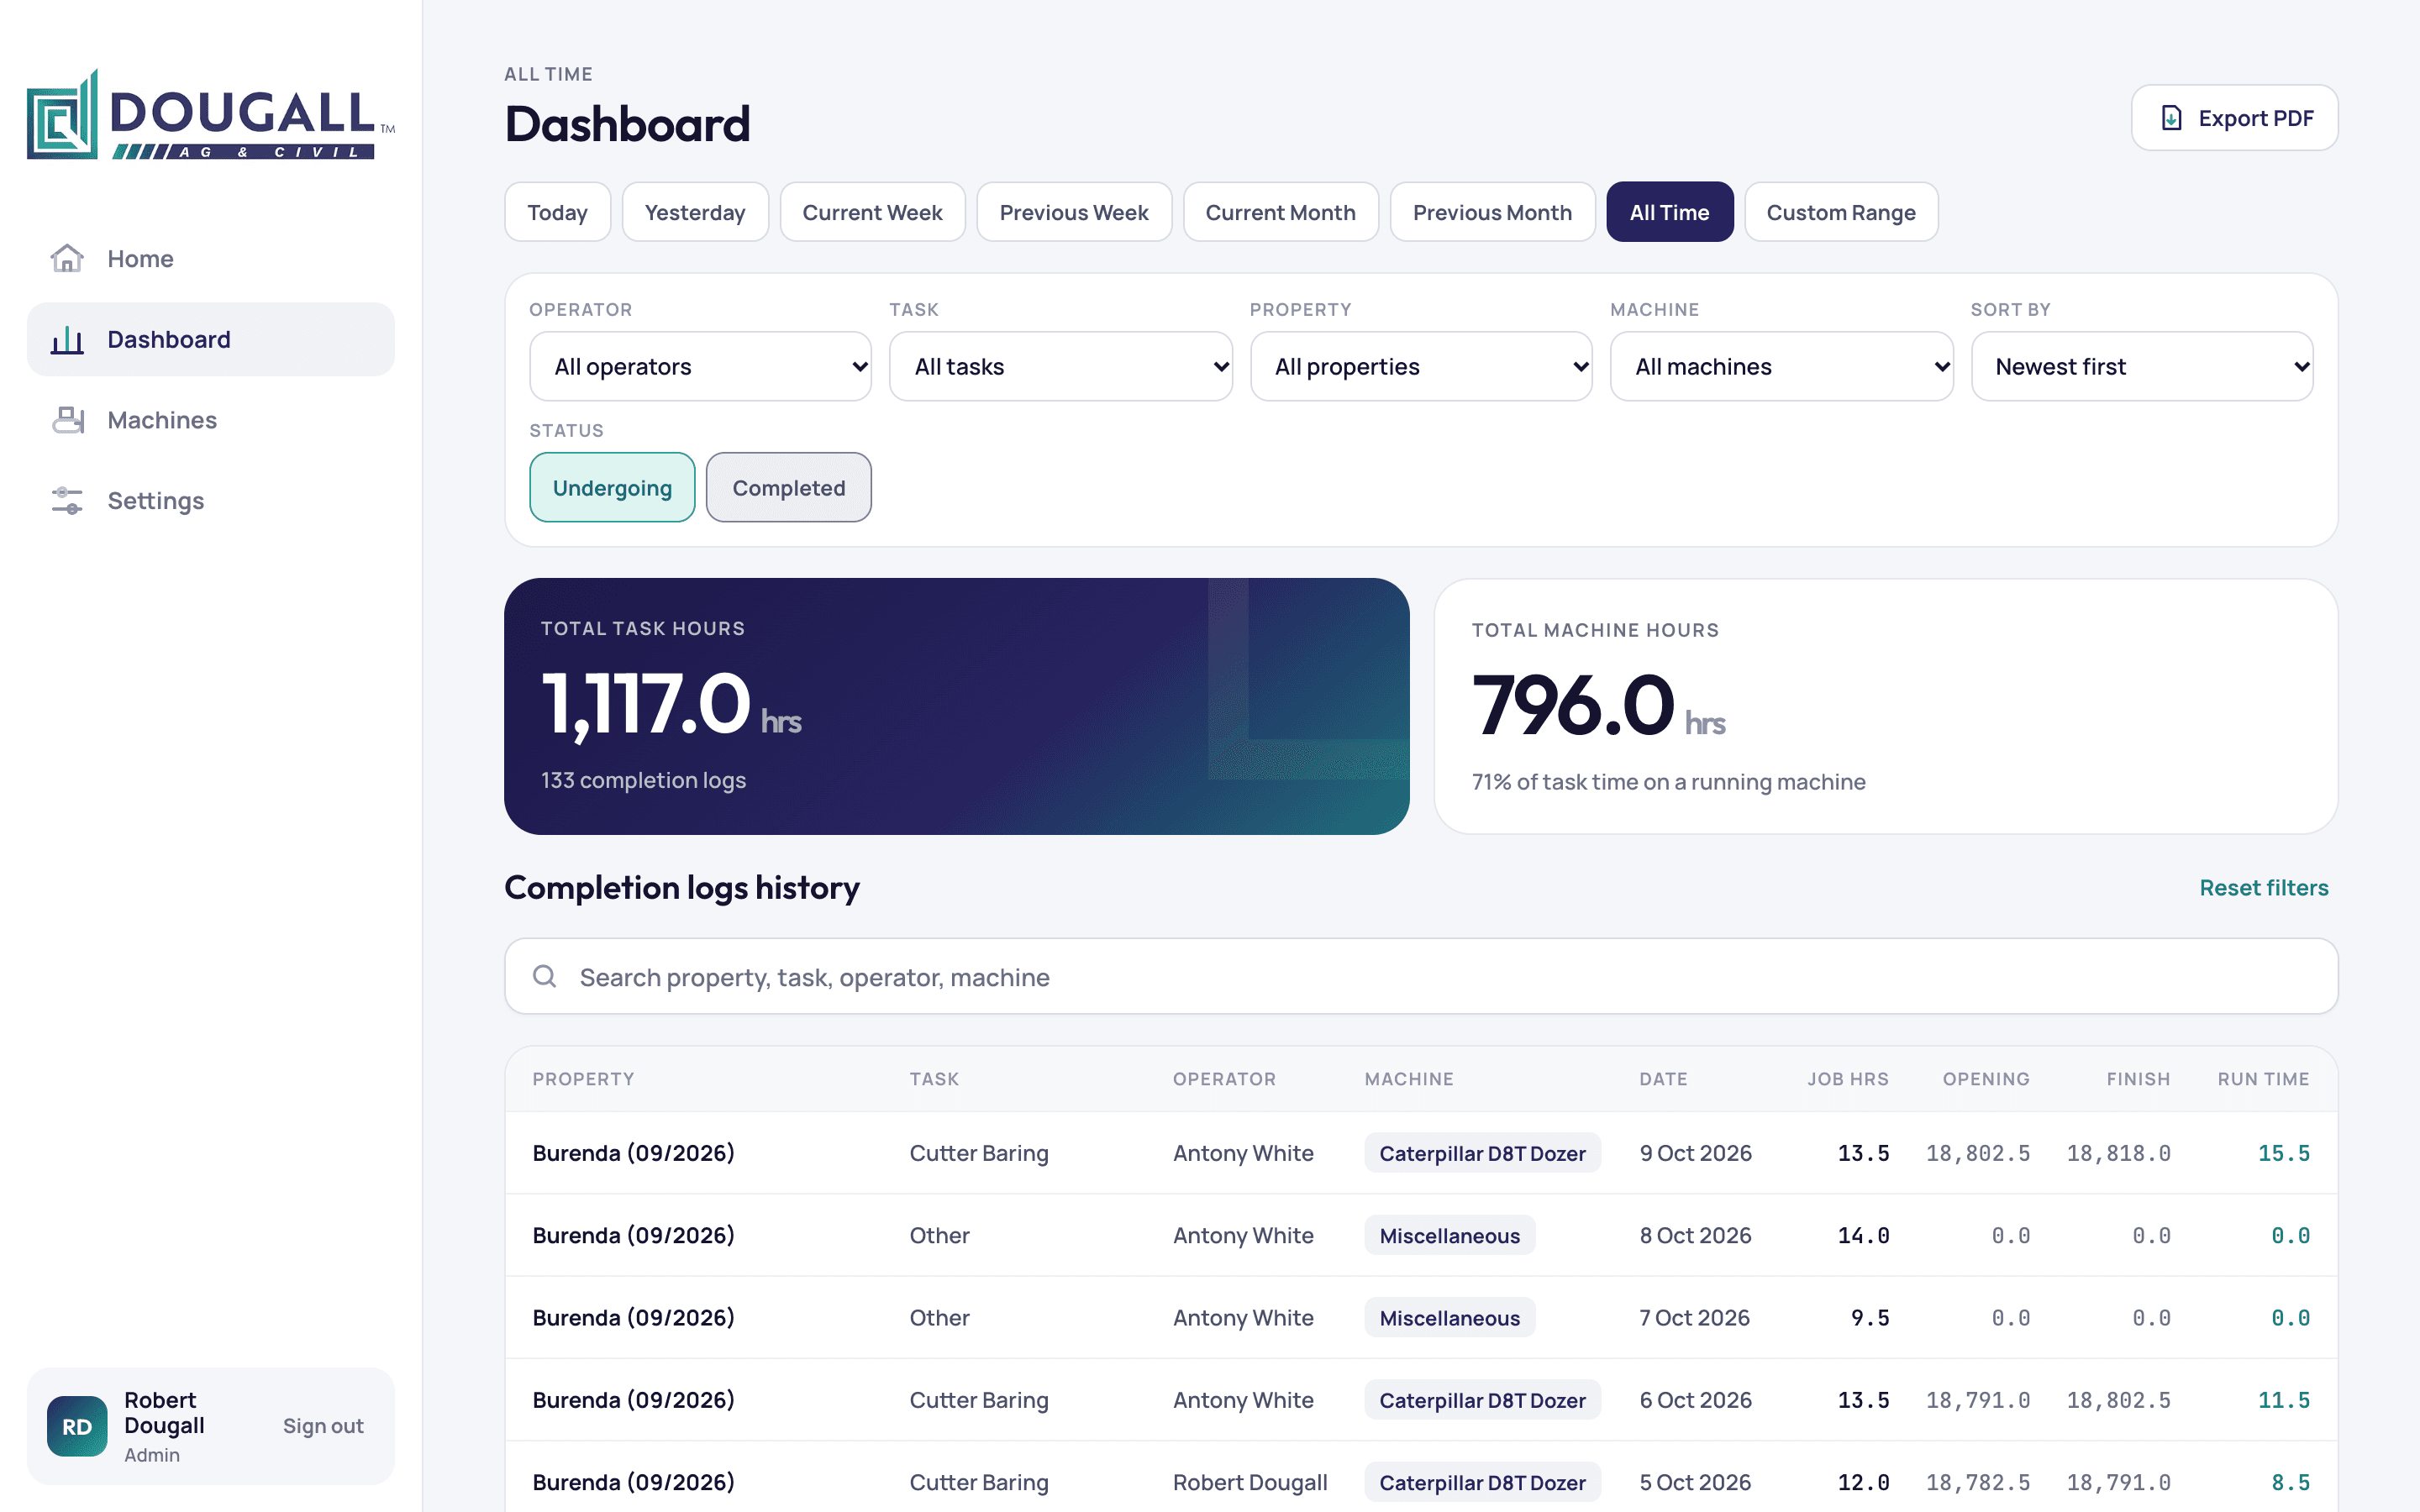
Every machine hour logged from the field. Every job's profit in one place.
An earthmoving contractor in Queensland now runs jobs, operator hours, machine hours and profit from one custom app, built in 16 days.
Construction & field services · Internal Tools · Portals
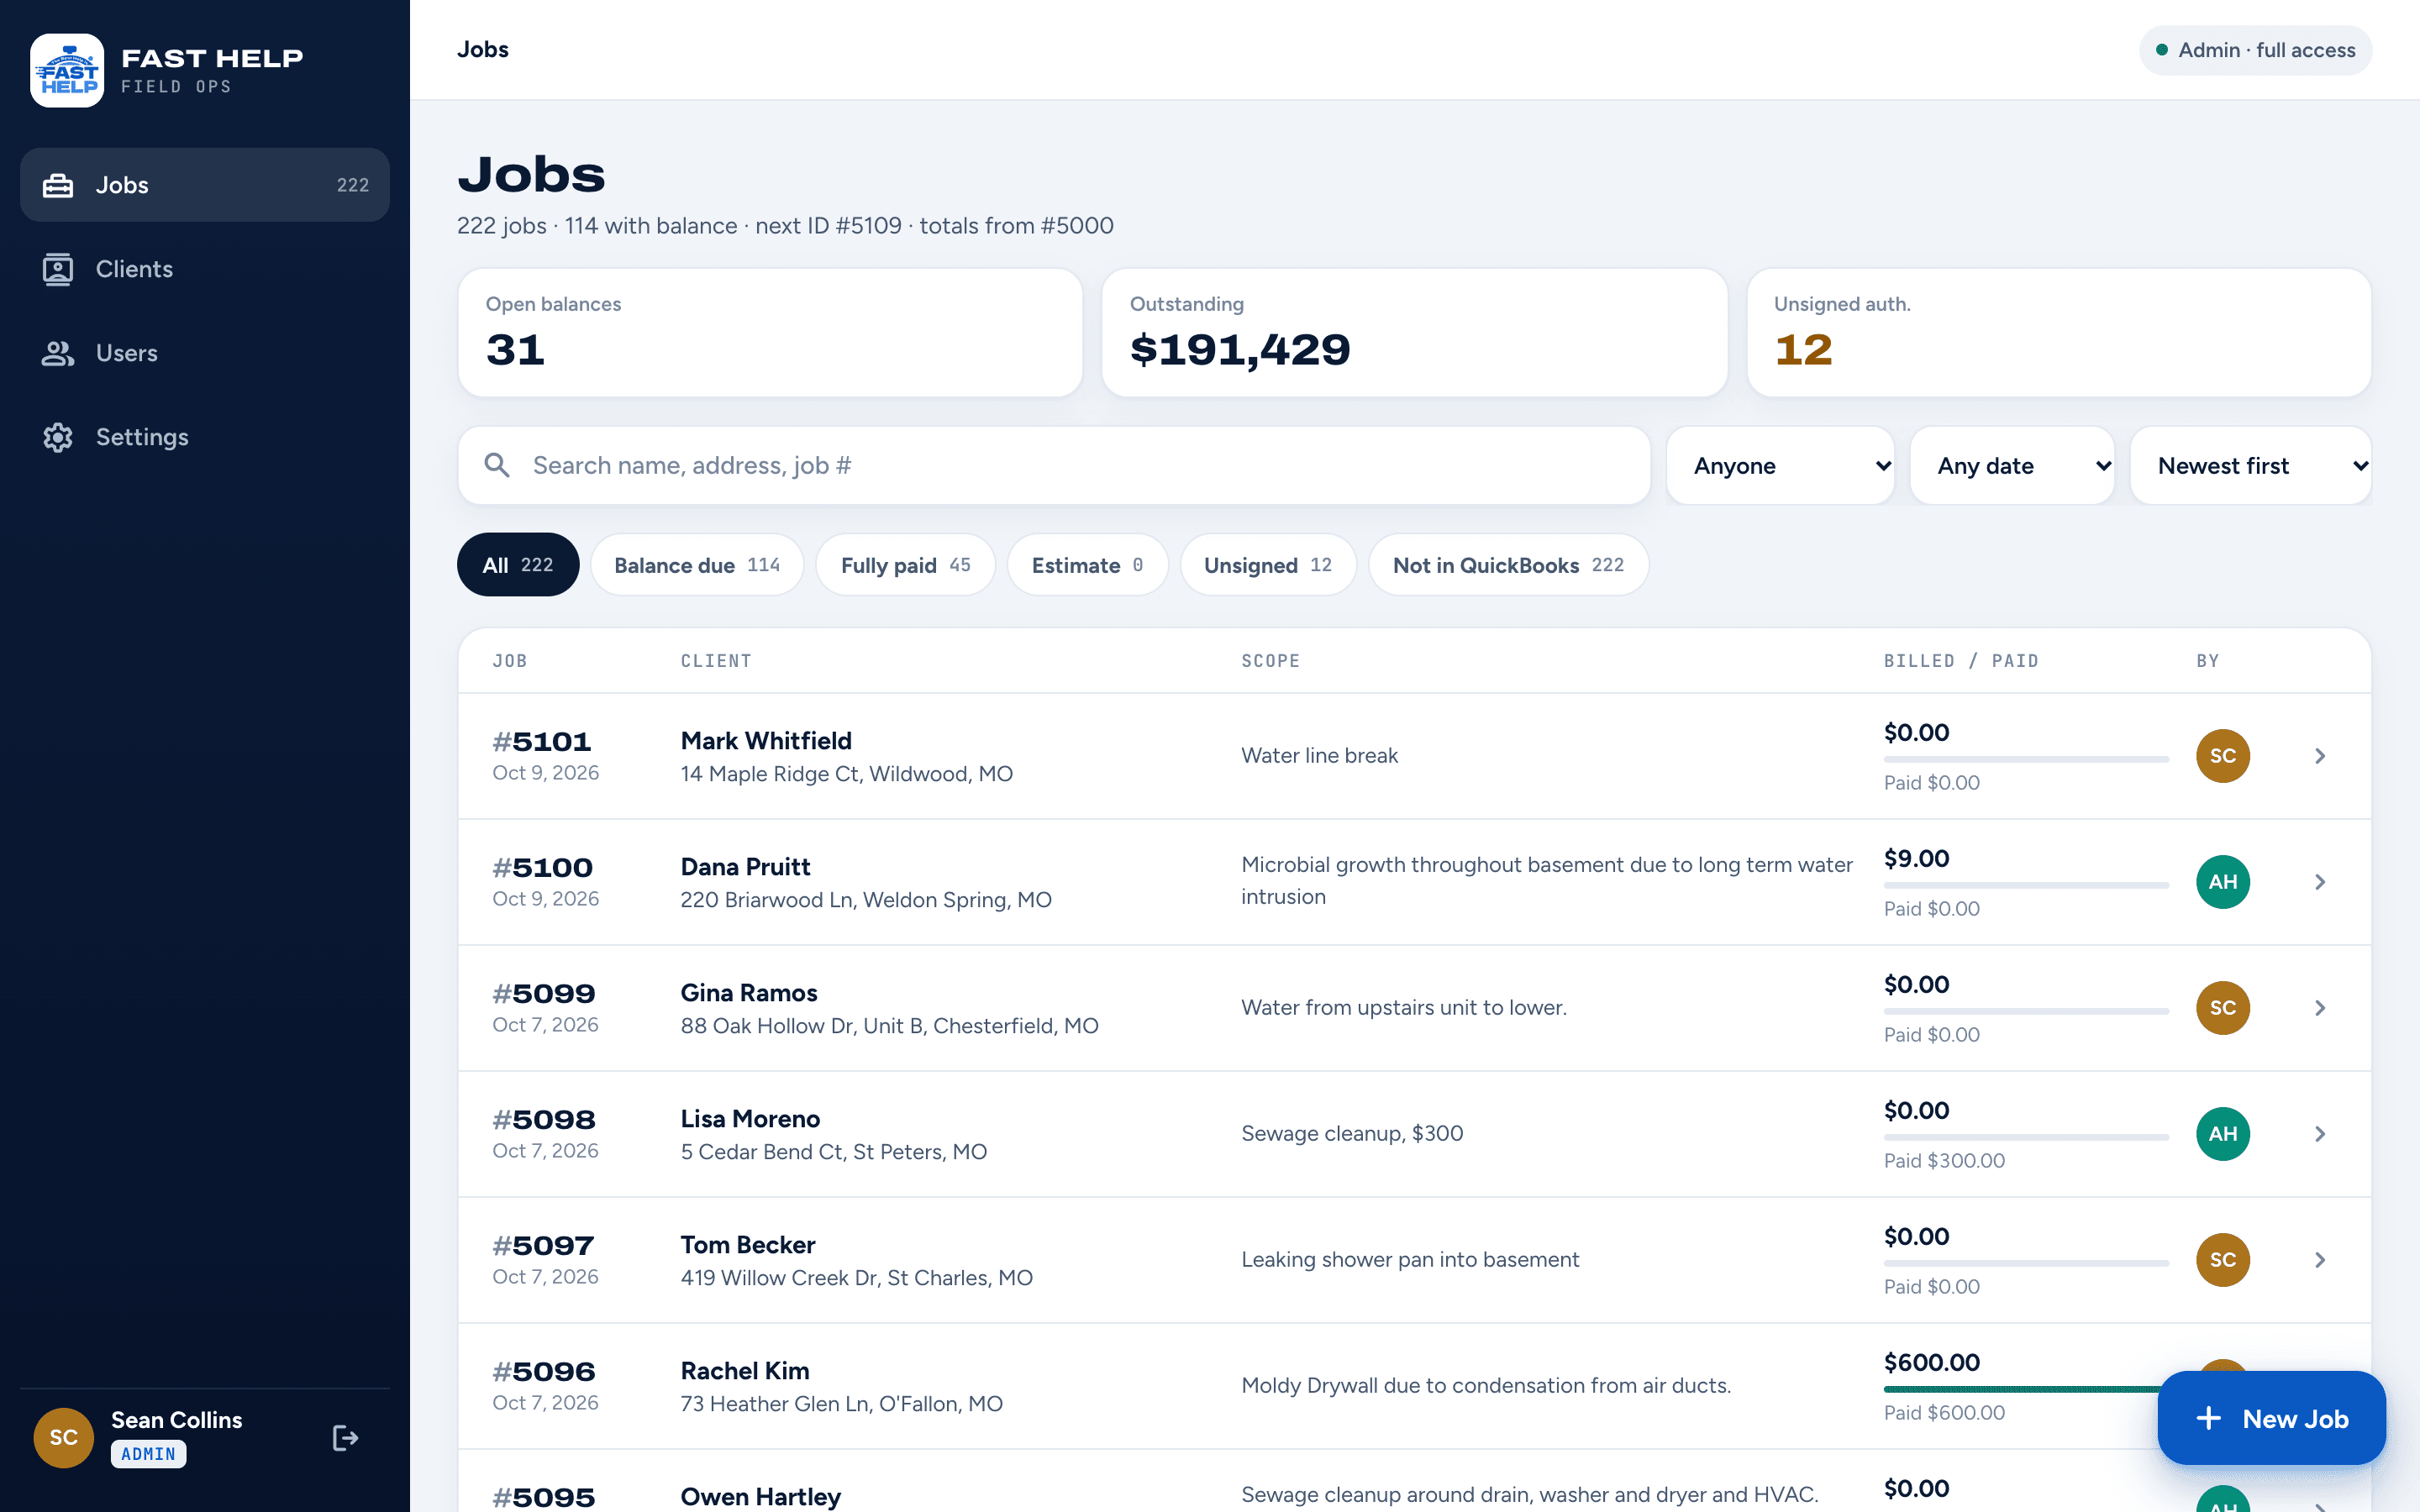
Every water job's photos, paperwork and payments. One app the crew carries all day.
A St. Louis water and fire restoration company now runs every job from one custom app, from the first photo to the signed authorization to the invoice. It was built and live in 21 days.
Construction & field services · Portals · Automation
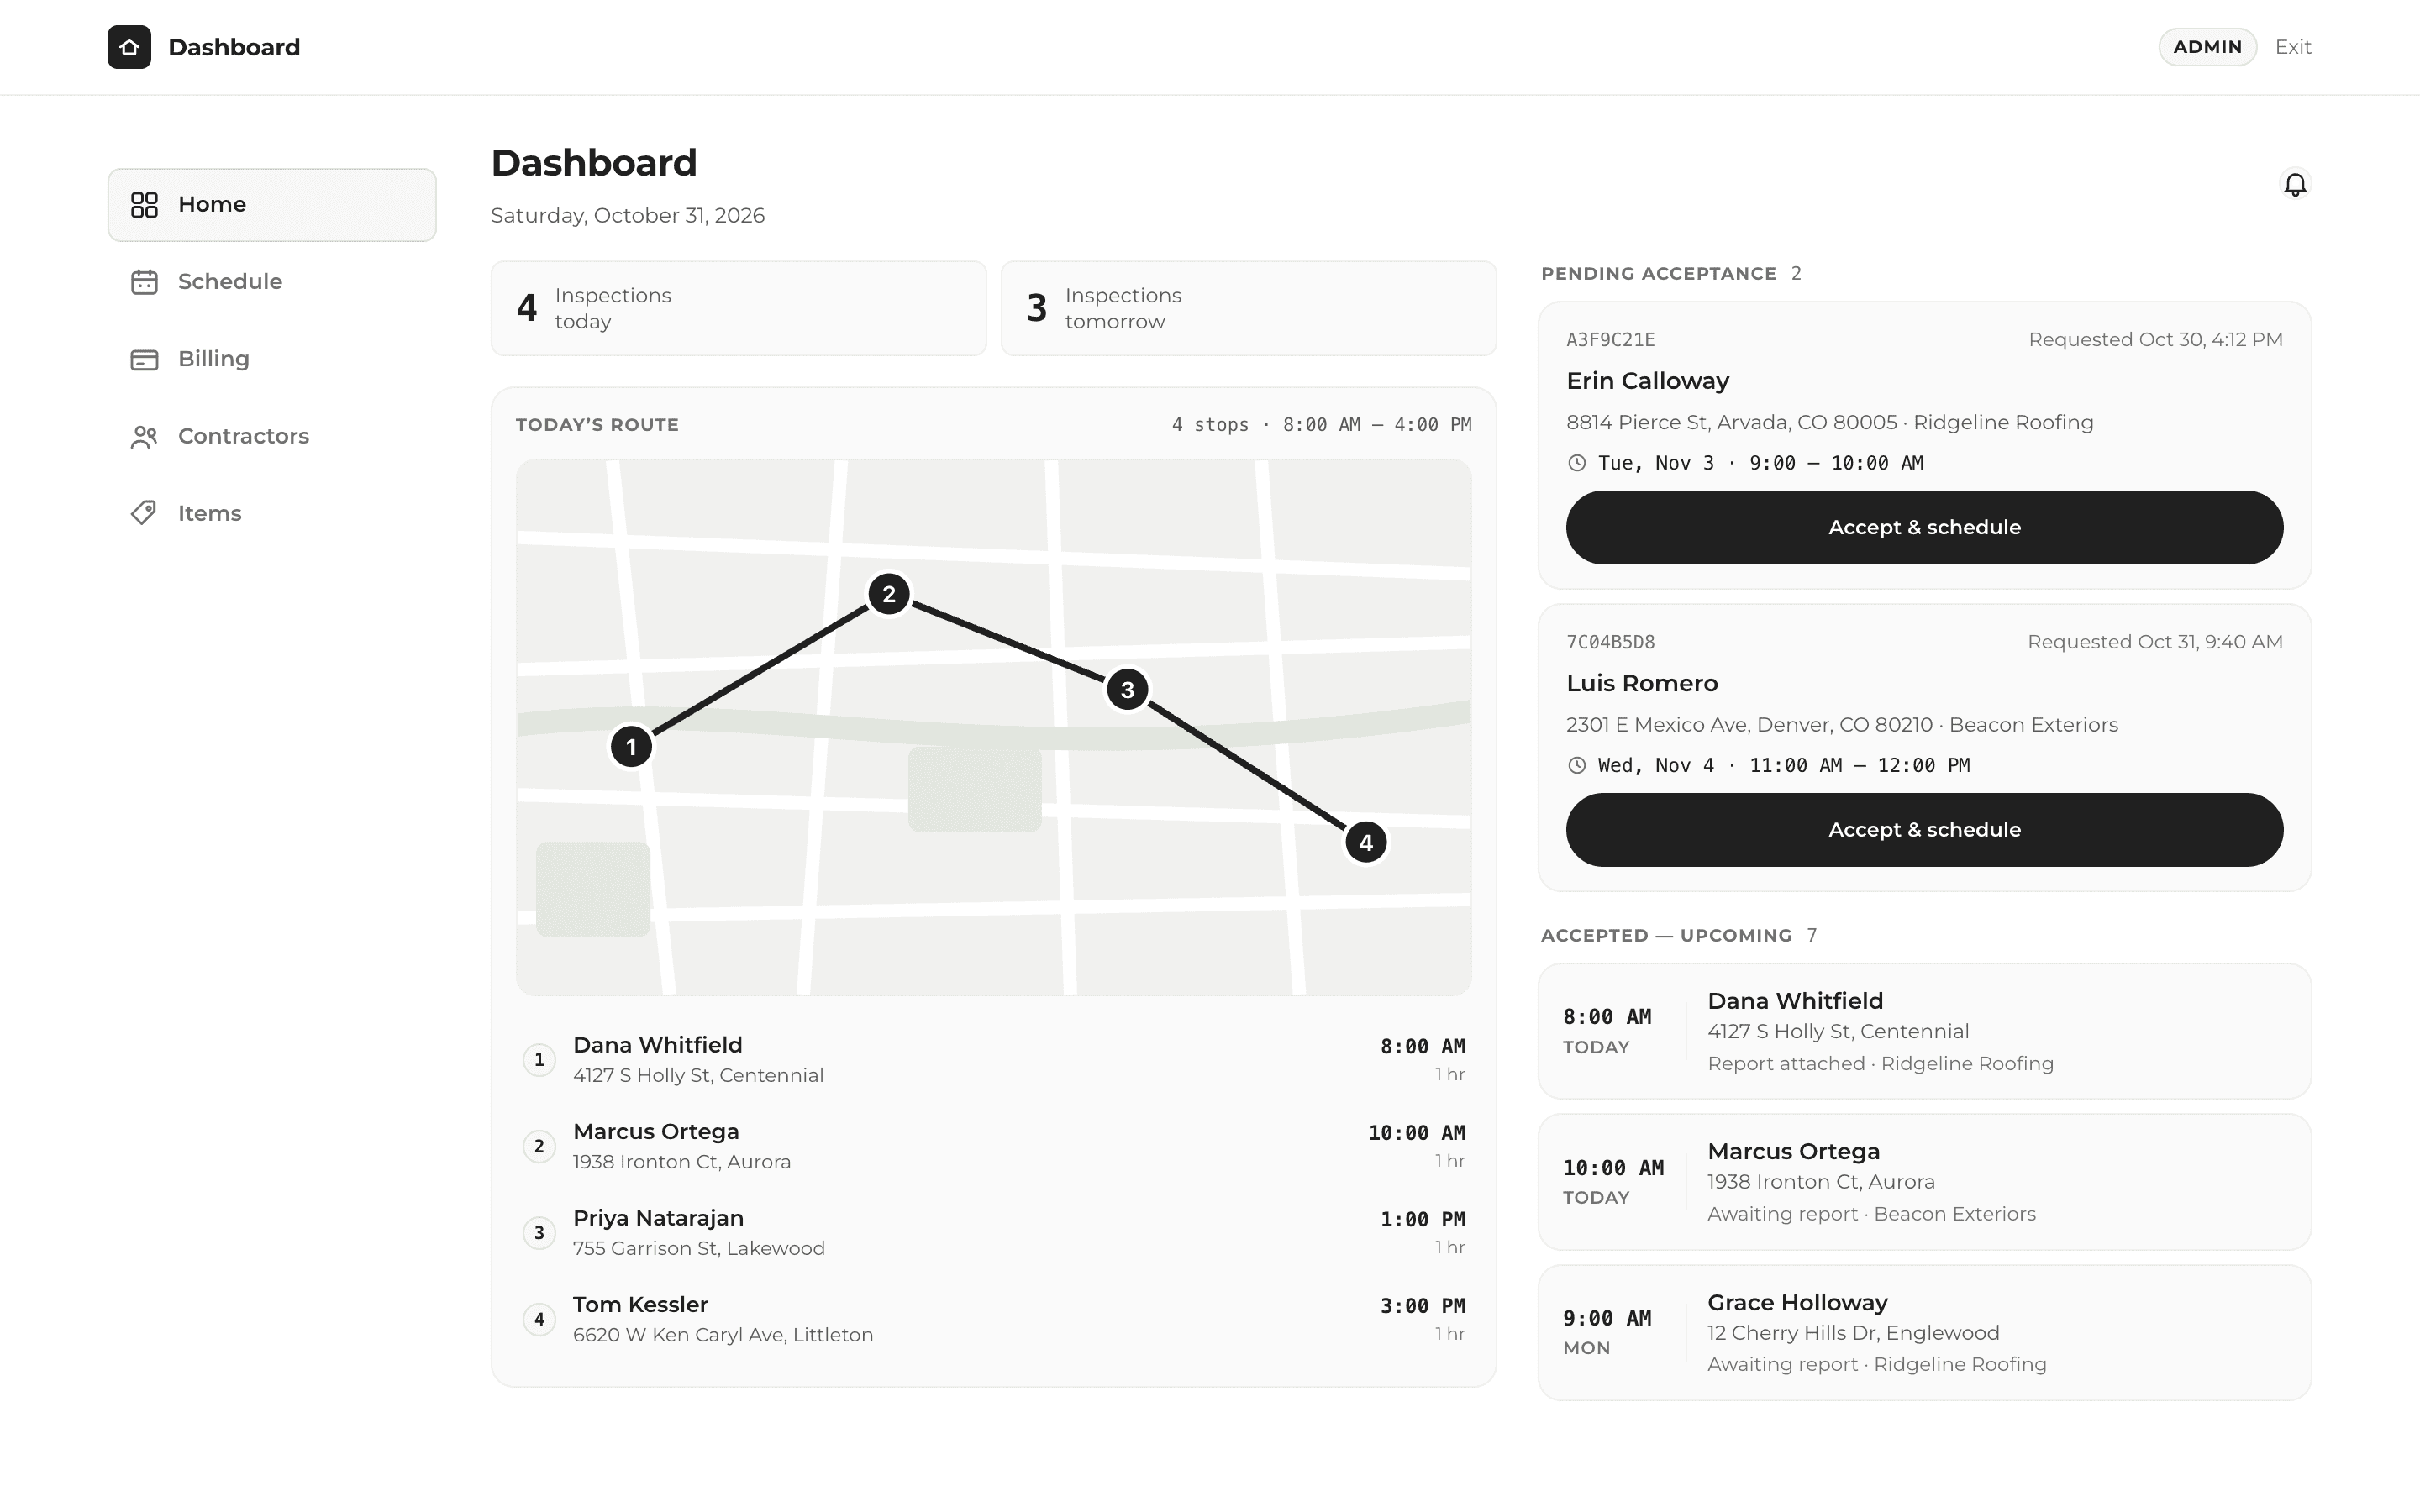
One click to finish the job, send the report and get paid.
A roof inspection company now takes bookings, runs its day and bills contractors from one custom app, built in 14 days.
Have a problem like this one?
A free 30-minute call. We'll look at how you work today and map out what could change.